3 Figure 3
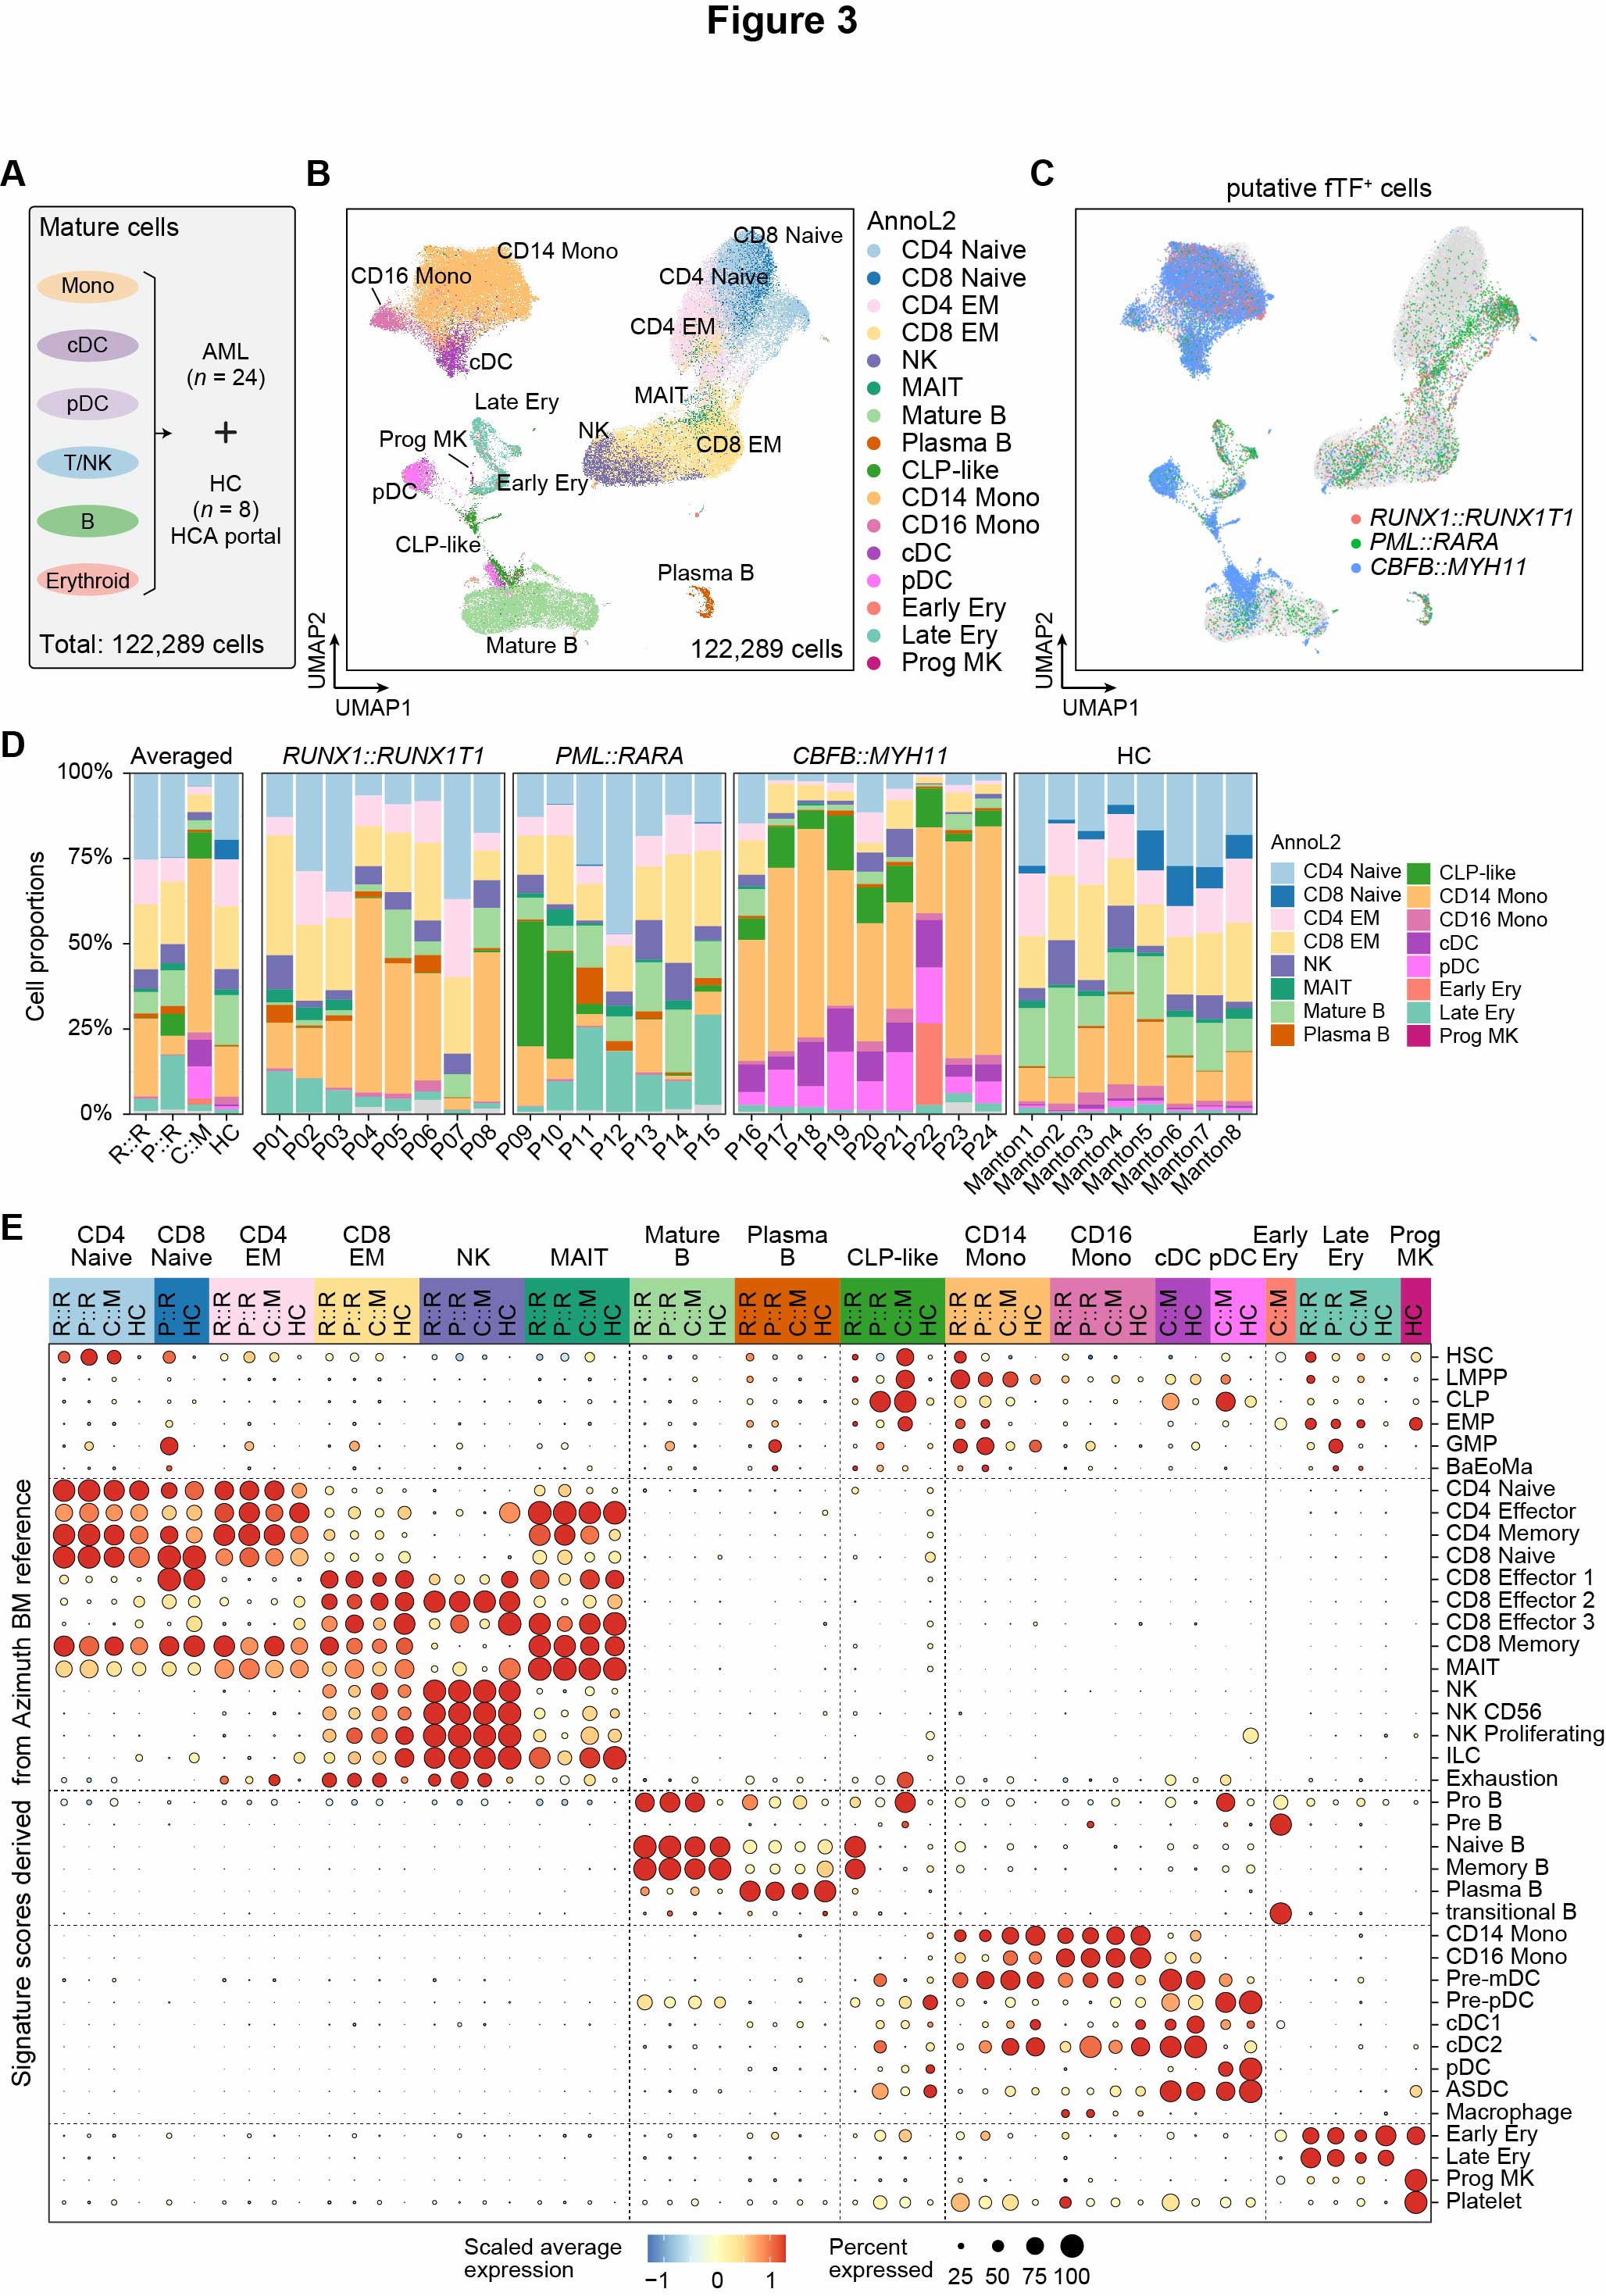 Fig. 3. Transcriptional aberrations in mature myeloid and lymphoid cells
(A) Illustration of merged analysis of mature cells from AML BMs, using mature cells from 8 healthy BM samples as controls. (B) UMAP visualization of de novo clustering of mature cells from RUNX1::RUNX1T1, PML::RARA, CBFB::MYH11 AML and HC samples. The total number of sequenced cells is indicated in the bottom-right corner. (C) UMAP visualization showing the distribution of putative fTF+ cells: RUNX1::RUNX1T1 (red), PML::RARA (green), and CBFB::MYH11 (blue), with grey representing putative fTF- cells. (D) Bar charts depicting the relative fractions of 16 annotated cell types (annoL2) across different groups. The left panel shows the average fractions for each group, while the other panels present individual sample fractions. (E) Dot plots showing signature scores for gene sets representing distinct hematopoietic cell types, based on Azimuth BM cell type annotation level 2. R::R, RUNX1::RUNX1T1 AML; P::R, PML::RARA AML; C::M, CBFB::MYH11 AML.
3.1 (B) UMAP distribution
scAML.O.anno <- read_rds(paste0(in_dir, "Table1.3.scAML.O_harmony.anno.rds"))

anno_color.O <- c("#A6CEE3", "#1F78B4", "#FDDAEC", "#FEE090", "#7570B3", "#1B9E77",
                  "#A1D99B", "#D95F02", "#33A02C",
                  "#FDBF6F", "#DE77AE", "#AB47BC", "#FF77F8",
                  "#FB8072", "#73C8B4", "#C51B7D", "#D9D9D9")
anno_name.O <- c("CD4Naive", "CD8Naive", "CD4EM", "CD8EM", "NK", "MAIT",
                 "MatureB", "PlasmaB", "CLP-like",
                 "CD14Mono", "CD16Mono", "cDC", "pDC",
                 "EarlyE", "LateE", "ProgMK", "LowQual")
names(anno_color.O) <- anno_name.O

pdf(paste0(out_dir, "Fig3B.pdf"), width = 6, height = 4.5)
DimPlot(scAML.O.anno, reduction = "umap", group.by = "annoL2",
        label = T, repel = T, raster = T, cols = anno_color.O, pt.size = 0.3)
dev.off()
3.2 (C) Fusion distribution
scAML.O.anno.sub <- scAML.O.anno %>% subset(annoL2 != "LowQual")
res_pred <- read_rds(paste0(in_dir, "Table1.res_pred.351594.rds")) %>%
    rownames_to_column("ID") %>% dplyr::select(ID, SS.final_fus_group)

df <- scAML.O.anno.sub@meta.data %>%
        rownames_to_column("ID") %>%
        left_join(., res_pred) %>%
        mutate(fus_group2 = case_when(
            (SS.final_fus_group == "Malignant" & FAB == "M2AE") ~ "M2AE",
            (SS.final_fus_group == "Malignant" & FAB == "M3PR") ~ "M3PR",
            (SS.final_fus_group == "Malignant" & FAB == "M4CM") ~ "M4CM",
            (SS.final_fus_group == "Unclear") ~ "ANA")) %>%
        left_join(., scAML.O.anno.sub@reductions$umap@cell.embeddings %>% data.frame() %>% rownames_to_column("ID")) %>%
            column_to_rownames("ID")


df1 <- df %>% filter(SS.final_fus_group == "Unclear")
df2 <- df %>% filter(SS.final_fus_group != "Unclear") %>% sample_n(nrow(.))
pdf(paste0(out_dir, "Fig3C.pdf"), width = 4.7, height = 3.5)
rbind(df1, df2) %>%
    mutate(mysize = ifelse((SS.final_fus_group == "Unclear"), 1, 2)) %>%
ggplot() +
  ggrastr::rasterise(geom_point(aes_string(x = "umap_1", y = "umap_2", color = "fus_group2", size = "mysize"),
        stroke = 0, alpha = 1), dpi = 300) +
  scale_color_manual(values = c("#D9D9D9", "#F8766D", "#00BA38", "#619CFF")) +
  scale_size_continuous(range = c(0.05, 0.2)) +
  ggthemes::theme_few()
dev.off()
3.3 (D) Bar charts
p1 <- plot_stat(scAML.O.anno, plot_type = "prop_fill", group_by = "FAB", pal_setup = anno_color.O) +
    theme(axis.text.x = element_text(angle = 45, hjust = 1, vjust = 1))
p2 <- plot_stat(scAML.O.anno, plot_type = "prop_fill", group_by = "orig.ident", pal_setup = anno_color.O) +
    theme(axis.text.x = element_text(angle = 45, hjust = 1, vjust = 1))

pdf(paste0(out_dir, "Fig3D.pdf"), width = 9,  height = 4)
p1 + p2 + plot_layout(ncol = 2, widths = c(0.45, 3.8), guides = "collect")
dev.off()
3.4 (E) Dot plots of signature scores
cd_features <- list(
    HSC_score = c("CRHBP", "AVP", "MYCT1", "BEX1", "NPR3", "CRYGD", "MSRB3", "CD34", "NPDC1", "MLLT3"),
    LMPP_score = c("AVP", "CRHBP", "C1QTNF4", "BEX1", "NPR3", "CD34", "NPW", "SMIM24", "CSF3R", "NPDC1"),
    CLP_score = c("ACY3", "PRSS2", "C1QTNF4", "SPINK2", "SMIM24", "NREP", "CD34", "DNTT", "FLT3", "SPNS3"),
    EMP_score = c("MYCT1", "CRHBP", "NPR3", "AVP", "GATA2", "HPGDS", "CYTL1", "CRYGD", "IGSF10", "PBX1"),
    GMP_score = c("SERPINB10", "RNASE3", "MS4A3", "PRTN3", "ELANE", "AZU1", "CTSG", "RNASE2", "RETN", "NPW"),
    BaEoMa_score = c("HDC", "MS4A2", "TPSAB1", "TPSB2", "CLC", "CPA3", "MS4A3", "IL1RL1", "PRG2", "HPGDS"),
    Early_Eryth_score = c("CNRIP1", "GATA2", "ITGA2B", "TFR2", "GATA1", "KLF1", "CYTL1", "MAP7", "FSCN1", "APOC1"),
    Late_Eryth_score = c("CTSE", "TSPO2", "IFIT1B", "TMEM56", "RHCE", "RHAG", "SPTA1", "ADD2", "EPCAM", "HBG1"),
    Prog_Mk_score = c("CLEC1B", "SPX", "WFDC1", "ANXA3", "CMTM5", "SELP", "RBPMS2", "ARHGAP6", "GP9", "LTBP1"),
    Platelet_score = c("RGS18", "C2orf88", "TMEM40", "GP9", "PF4", "PPBP", "DAB2", "SPARC", "RUFY1", "F13A1"),
    CD14_Mono_score = c("FOLR3", "CLEC4E", "MCEMP1", "RBP7", "CDA", "FPR1", "CD300E", "C5AR1", "CD93", "APOBEC3A"),
    CD16_Mono_score = c("LYPD2", "VMO1", "TPPP3", "C1QA", "C5AR1", "CD300E", "GPBAR1", "LILRA1", "HES4", "APOBEC3A"),
    pre_mDC_score = c("ENHO", "CLEC10A", "RNASE2", "PLBD1", "FCER1A", "IGSF6", "MNDA", "SAMHD1", "ALDH2", "PAK1"),
    pre_pDC_score = c("SCT", "SHD", "LILRA4", "LILRB4", "PTPRS", "TNNI2", "PLD4", "SPIB", "IRF8", "TNFRSF21"),
    cDC1_score = c("IDO1", "XCR1", "TACSTD2", "CLEC9A", "WFDC21P", "CLNK", "CADM1", "DNASE1L3", "BATF3", "LGALS2"),
    cDC2_score = c("ENHO", "CLEC10A", "CD1C", "IL13RA1", "PLBD1", "LGALS2", "CD33", "IGSF6", "IFI30", "FCER1A"),
    pDC_score = c("ASIP", "CLEC4C", "SCAMP5", "PROC", "PTCRA", "SCT", "SHD", "PPM1J", "LILRA4", "LRRC26"),
    ASDC_score = c("AXL", "SCT", "LILRA4", "PPP1R14A", "TGFBI", "UPK3A", "SCN9A", "CLEC10A", "PROC", "PLD4"),
    Macrophage_score = c("SPIC", "FABP3", "CD5L", "CCL18", "C1QC", "C1QB", "FABP4", "C1QA", "APOE", "SELENOP"),
    CD4_Naive_score = c("TSHZ2", "MAL", "CCR7", "CAMK4", "LEF1", "BCL11B", "FHIT", "RCAN3", "SH3YL1", "PIK3IP1"),
    CD4_Effector_score = c("TNFRSF4", "AQP3", "TNFRSF25", "MAL", "IL7R", "TRAT1", "RORA", "FLT3LG", "KLRB1", "CD6"),
    CD4_Memory_score = c("MAL", "TRAT1", "AP3M2", "CAMK4", "AQP3", "IL7R", "RCAN3", "BCL11B", "LEF1", "FLT3LG"),
    CD8_Naive_score = c("NELL2", "CD8B", "S100B", "TRABD2A", "CCR7", "OXNAD1", "FLT3LG", "MAL", "LEF1", "CAMK4"),
    CD8_Effector_1_score = c("CRTAM", "IFNG", "CD8A", "XCL1", "GZMK", "TIGIT", "CCL4L2", "CD8B", "CD160", "XCL2"),
    CD8_Effector_2_score = c("ZNF683", "PRSS23", "KLRC2", "FCRL6", "S1PR5", "GZMH", "FGFBP2", "PATL2", "TRGC2", "CD3G"),
    CD8_Effector_3_score = c("GZMK", "CD160", "CD8A", "KLRB1", "LAG3", "CCL4", "XCL2", "GZMM", "XCL1", "CCL3"),
    CD8_Memory_score = c("CD8B", "CD8A", "GZMK", "IL7R", "BCL11B", "CD3E", "PIK3IP1", "CD6", "TRAC", "SPOCK2"),
    T_Proliferating_score = c("RRM2", "MKI67", "BIRC5", "LCK", "SH2D1A", "CLSPN", "CDT1", "TK1", "TOP2A", "TRAC"),
    MAIT_score = c("KLRB1", "IL7R", "TNFRSF25", "SPOCK2", "RORA", "NCR3", "GZMK", "KLRG1", "TRGC2", "CD6"),
    NK_score = c("SH2D1B", "PRSS23", "S1PR5", "LAIR2", "KLRC1", "PTGDR", "FGFBP2", "FCRL6", "TBX21", "KLRC2"),
    NK_CD56_score = c("SPTSSB", "NCAM1", "KLRC1", "XCL1", "IL18RAP", "XCL2", "IL2RB", "KLRF1", "TNFRSF18", "KLRD1"),
    NK_Proliferating_score = c("GZMA", "GZMB", "TRDC", "PRF1", "TYMS", "FGFBP2", "KLRF1", "CD247", "GZMH", "CCL4"),
    ILC_score = c("LDB2", "CD160", "XCL2", "KLRB1", "XCL1", "KLRF1", "KLRD1", "KLRC1", "TRDC", "GZMM"),
    pro_B_score = c("CYGB", "UMODL1", "EBF1", "MME", "VPREB1", "DNTT", "IGLL1", "UHRF1", "BLNK", "AGPS"),
    pre_B_score = c("NPY", "LCN6", "RAG2", "HMHB1", "ARPP21", "AKAP12", "RAG1", "C10orf10", "CYGB", "SLC8A1-AS1"),
    Naive_B_score = c("FCRL2", "FCRL1", "ARHGAP24", "FCRL5", "FCER2", "FCRLA", "PAX5", "CD19", "HLA-DOB", "CD22"),
    Memory_B_score = c("FCRL2", "TNFRSF13B", "ARHGAP24", "PNOC", "FCER2", "FCRLA", "BLK", "HLA-DOB", "MS4A1", "TNFRSF13C"),
    Plasma_score = c("SDC1", "IGLC6", "IGLV6-57", "TNFRSF17", "IGLV3-1", "TNFRSF13B", "IGLC7", "JSRP1", "FCRL5", "IGKV1-5"),
    transitional_B_score = c("BMP3", "CFAP73", "ARPP21", "IGLC5", "APBB2", "HRK", "DTX1", "AKAP12", "IGLC6", "MME"),
    Exhaustion_score = c("CTLA4", "PDCD1", "TIGIT", "LAG3", "HAVCR2", "TOX"),
    HLA1_score = c("HLA-A", "HLA-B", "HLA-C", "HLA-E", "HLA-F", "HLA-G"),
    HLA2_score = c("HLA-DRA", "HLA-DRB", "HLA-DQA1", "HLA-DQA2", "HLA-DQB1", "HLA-DQB2", "HLA-DPA1", "HLA-DPA2", "HLA-DPB1", "HLA-DPB2", "HLA-DMA", "HLA-DMB", "HLA-DOA", "HLA-DOB", "HLA-DRB1", "HLA-DRB2", "HLA-DRB3", "HLA-DRB4", "HLA-DRB5", "HLA-DRB6", "HLA-DRB7", "HLA-DRB8", "HLA-DRB9")
)

idx_feature = rev(names(cd_features))
p <- DotPlot(object = scAML.O.anno, assay = "RNA", features = idx_feature, cols = "RdYlBu",
        group.by = "FAB", split.by = "annoL2") +
        geom_point(aes(size = pct.exp), shape = 21, stroke = 0.2) +
        theme_bw() + theme(axis.text.x = element_text(angle = 90, hjust = 1, vjust = 0.5)) + coord_flip()

idx.sel <- scAML.O.anno@meta.data %>% group_by(FAB, annoL2) %>% summarise(N = n()) %>%
        filter(N >= 10 & !annoL2 %in% "LowQual") %>% unite("id", c(FAB, annoL2)) %>% pull(id)
my_c <- unique(str_replace_all(idx.sel, "M2AE_|M3PR_|M4CM_|HC_BMMC_", ""))

####
df_raw <- p$data %>%
                filter(id %in% idx.sel) %>%
                mutate(features.plot = factor(features.plot,
                       levels = rev(names(cd_features)[c(1:6, 20:33, 40, 34:39, 11:19, 7:10, 41:42)]))) %>%
                filter(features.plot %in% names(cd_features)[1:40]) %>%
                mutate(FAB = str_extract(id, "M2AE|M3PR|M4CM|HC_BMMC"),
                       annoL2 = str_replace_all(id, "M2AE_|M3PR_|M4CM_|HC_BMMC_", "")) %>%
                mutate(annoL2 = factor(annoL2, levels = anno_name.O[anno_name.O %in% my_c]))
p1 <- df_raw %>%
        group_by(features.plot) %>%
        mutate(avg.exp.scaled = as.numeric(scale(MinMax(log1p(avg.exp), -2, 50)))) %>% ungroup() %>%
        mutate(avg.exp.scaled = MinMax(avg.exp.scaled, -1.3, 1.3)) %>%
    ggplot() +
        geom_point(aes(x = id, y = features.plot, fill = avg.exp.scaled, size = pct.exp), shape = 21, stroke = 0) +
        facet_grid( ~ annoL2, scales = "free", space = "free") +
        scale_fill_distiller(palette ="RdYlBu") +
    theme_bw() + theme(axis.text.x = element_text(angle = 90, hjust = 1, vjust = 0.5)) +
    scale_radius(range = c(1, 6))


pdf(paste0(out_dir, "Fig3E.pdf"), width = 15, height = 9)
p1
dev.off()